Using the Capo extension

Capo is a Chrome extension that gives you one-click access to the capo.js script. Clicking the extension icon ( ![]() ) will open a color bar visualizing the
) will open a color bar visualizing the <head> ordering, and log messages to the console, including validation warnings and detailed element info.
Understanding the color bar
Section titled “Understanding the color bar”The first thing you’ll see when you click the Capo extension icon ( ![]() ) is the color bar. This is how Capo visualizes the actual order of the
) is the color bar. This is how Capo visualizes the actual order of the <head> elements as well as the sorted order, with the colors indicating the element weight.

The top row of colors represents the actual order of elements.
The bottom row of colors represents the sorted order of elements.
Ideally, the actual order will be very similar to the sorted order.
█ Red colors indicate the most important, highest-weighted elements, like pragma directives and the <title> element.
█ Green colors indicate the average-importance, medium-weighted elements, like synchronous scripts and styles.
█ Blue colors indicate low-importance, low-weighted elements, like deferred scripts and speculative resource hints.
█ Gray indicates the least important, lowest-weighted elements, as a catch-all for everything else that doesn’t have an explicit weight, like social metadata.
See the Rules guide for a complete list of all the weights and what they measure.
Using Capo in the console
Section titled “Using Capo in the console”In addition to overlaying the color bar on top of the page, clicking the Capo extension icon ( ![]() ) also logs to the DevTools console.
) also logs to the DevTools console.
Color bars for the actual and sorted <head> orderings are show in addition to a summary of any validation warnings.
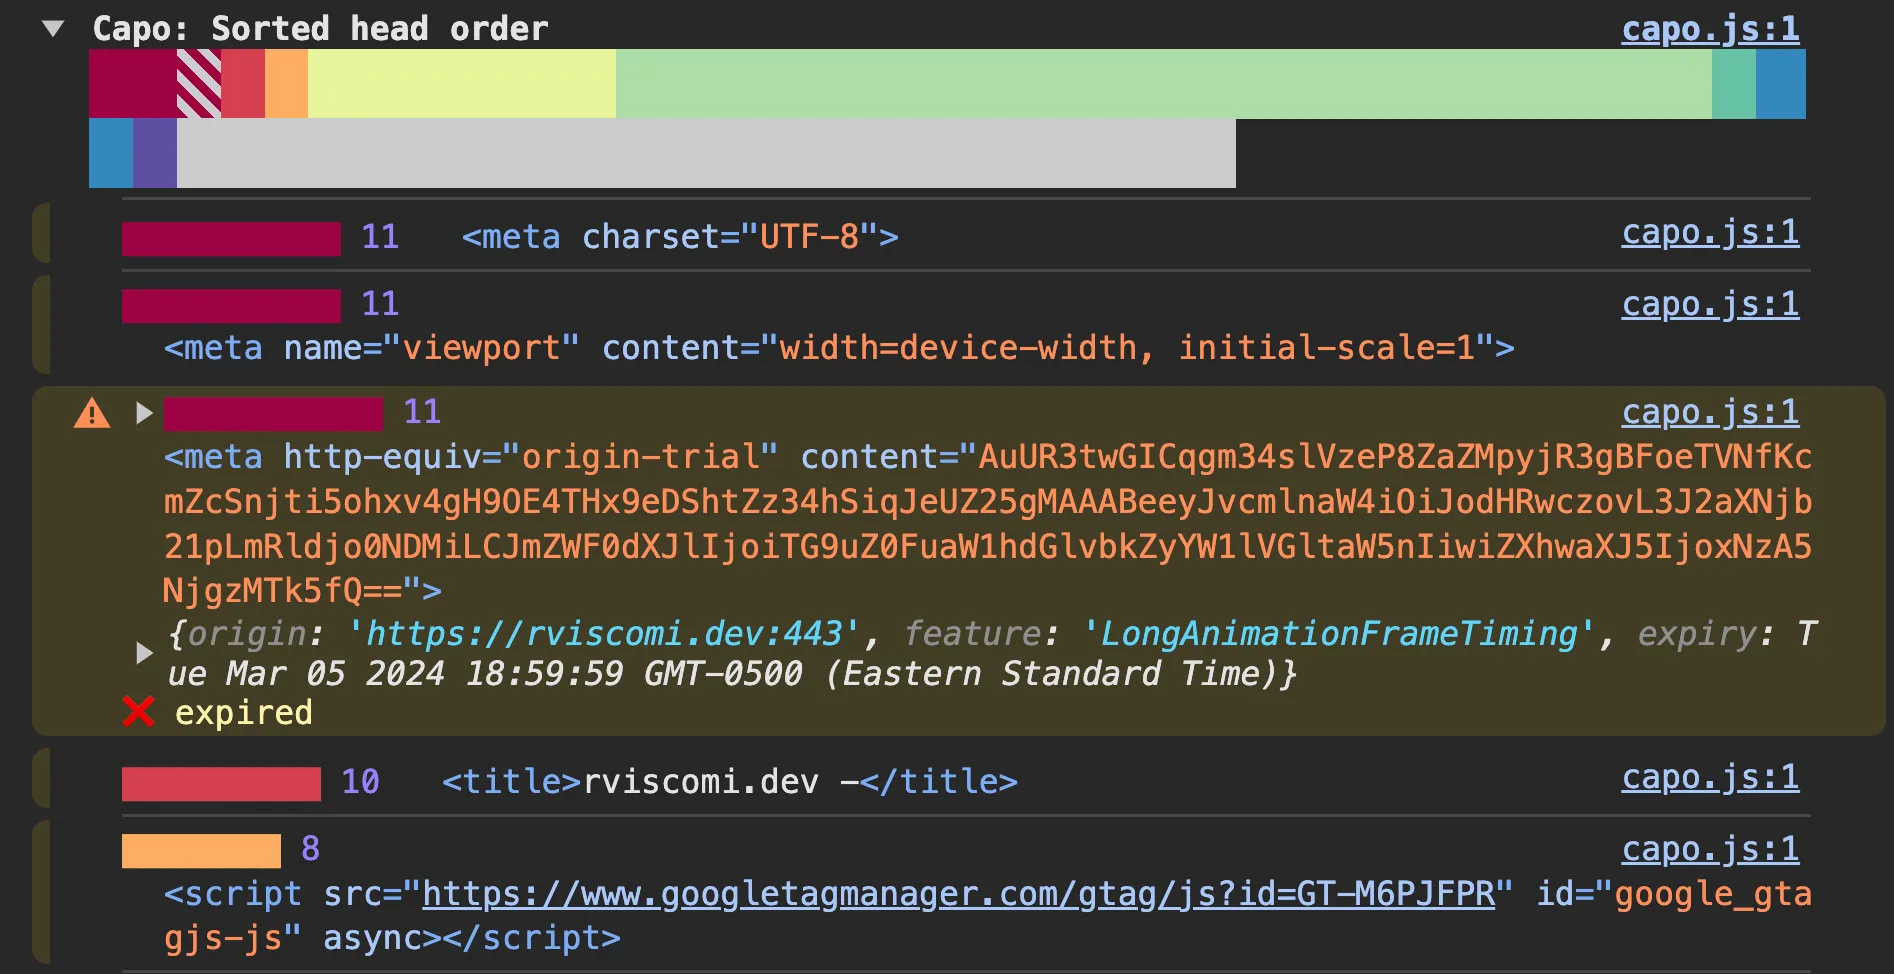
Color bars are rendered in a collapsed view by default. Clicking the color bar will expand it into the full details for each element in order. The details include:
- a visualization of the element weight as a colored bar and label
- a reference to the element
- additional validation info (where applicable)
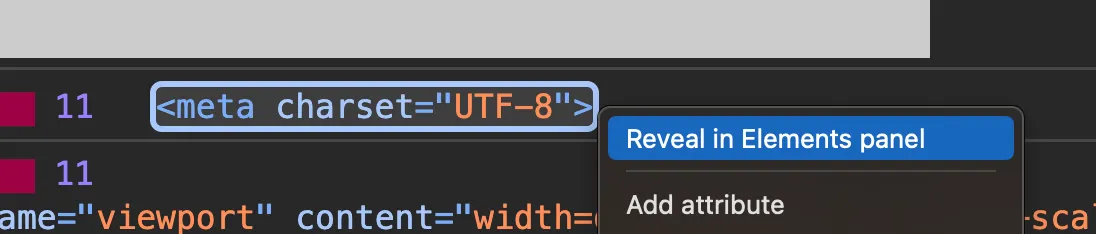
References to elements are interactive. Right-clicking on the element brings up a context menu with a list of actions you can take on the element. Some helpful actions include revealing the element in the Elements panel of DevTools and copying the element markup.
Installation
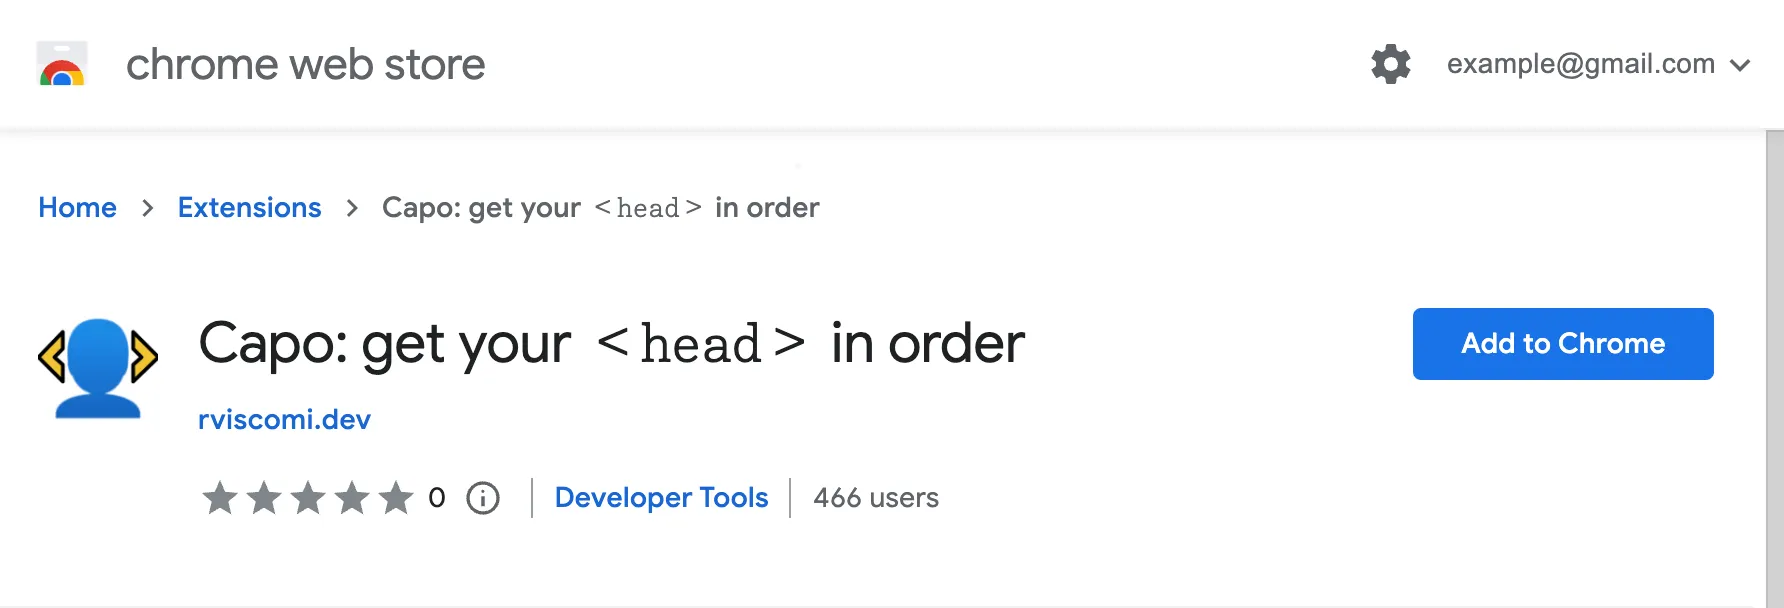
Section titled “Installation”To install the Capo extension:
-
Navigate to the Capo extension in the Chrome Web Store
-
Click the Add to Chrome button
-
On any page, click the Capo icon (
 ) in the browser toolbar
Open the DevTools Console to see additional logs
Configuration
Section titled “Configuration”
The extension comes with a few default options for static evaluation, validation, and the color palette.
See the Configuration guide for more info on accessing the options page and what each option does.